
Summary
Published studies put a standard car on an open carrier at $875 – $2,365 for a trip of about 1,250 miles, and $1,140 – $3,780 enclosed.
How the industry is organized
Carriers
Owns the trucks and employs or contracts the drivers who move your car.
- You deal directly with the company moving your car
- Limited to the routes and dates its own trucks run
- Must hold FMCSA operating authority and carry insurance
Brokers
Arranges your shipment with carriers in its network.
- Can search many carriers for your route and dates
- The carrier may be named only after you book
- Must hold FMCSA broker authority and a surety bond or trust fund
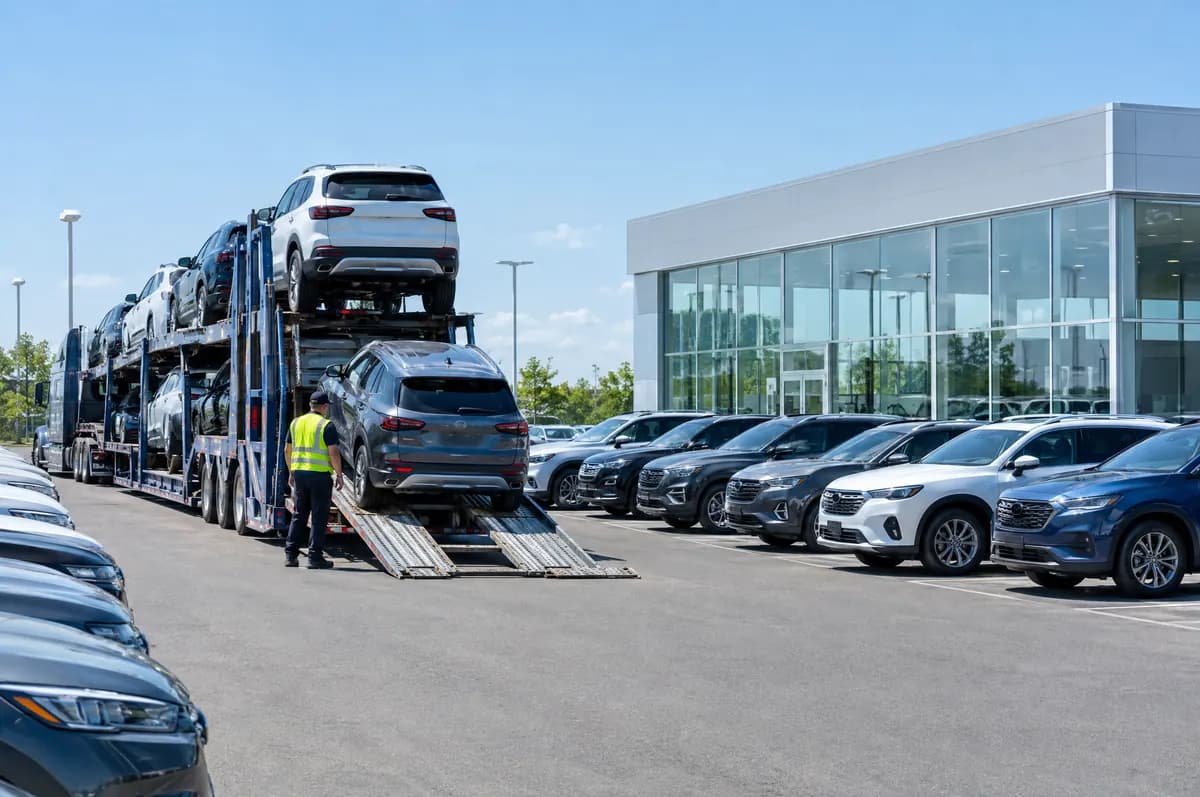
A typical open car carrier holds about 7 to 10 vehicles, limited by size and an 80,000-pound weight cap, while enclosed trailers often carry 1 to 7.
Regulation and licensing
Authority can be checked for free
Any broker or carrier's USDOT number, operating status and insurance on file can be looked up in the FMCSA database.
Source: FMCSA company snapshotBrokers must be bonded
Auto transport brokers need FMCSA broker authority and $75,000 in financial security, usually a BMC-84 surety bond or a BMC-85 trust fund.
Source: 49 CFR 387.307Carriers must carry liability insurance
Most for-hire interstate carriers must file at least $750,000 in liability coverage with the FMCSA. Cargo coverage for the cars on the truck is set by the carrier, so ask for the certificate.
Source: 49 CFR 387.9Drivers have daily driving limits
Truck drivers may drive up to 11 hours after 10 consecutive hours off duty, which is why long routes are measured in days, not hours.
Source: FMCSA hours of service
Open vs. enclosed transport
$875 – $2,365
Open transport
Standard car, about 1,250 miles
$1,140 – $3,780
Enclosed transport
Same trip, enclosed trailer
+30–60%
Enclosed premium
Across the published studies
Carrier capacity
No study we cite measures open truck space, so this section reports what the largest load board published about 2025 activity. These describe carriers, not customer prices.
- Nearly 10 millionVehicles moved in 2025Moved through the Super Dispatch load board in 2025, generating more than $5 billion in carrier revenue.Source: Super Dispatch
- +42%Long-haul shipments over 1,000 milesThe fastest-growing segment of the market in 2025.Source: Super Dispatch
- +27% year over yearNortheast deliveriesThe fastest-growing region, followed by the West at 19%.Source: Super Dispatch
- +19% year over yearWest deliveriesThe second-fastest-growing region after the Northeast.Source: Super Dispatch
- Nearly 60%Loads paid within five daysA measure of how quickly carriers are paid, not of shipping price.Source: Super Dispatch
Seasonal price swings
Prices move with the season
Summer moving season and the holidays tighten truck space, while mid-January to February is usually the quietest stretch of the year.
Direct Connect Auto Transport reports 2026 versus 2025 running 3% to 8% higher.
- 2026 versus 2025Rates run 3 to 8 percent higher than 2025.Source: Direct Connect Auto Transport
- Snowbird routesSnowbird corridors add 5 to 8 percent in season.Source: Direct Connect Auto Transport
- Military PCS seasonPCS season runs 5 to 15 percent above off-peak rates.Source: Direct Connect Auto Transport
Consumer risks and protection
- Took payment, no pickupA large deposit is paid, then no truck ever arrives.
- Bait-and-switch pricingA low quote wins the booking, then the price jumps.
- Fake or borrowed credentialsA company uses someone else's USDOT or MC number.
- Unauthorized re-brokeringYour car is handed to an unknown third party.


Trends to watch
- More electric vehicles. EVs are heavier than comparable gas cars, which affects how carriers load trucks and handle charge levels.
- Price transparency. Shoppers increasingly compare estimates and verify companies before booking, rewarding clear, all-in quotes.
- Seasonal concentration. Summer and snowbird peaks keep capacity tight on specific corridors at predictable times.
- Operating costs. Fuel, insurance and equipment costs flow through to rates over time; diesel prices are tracked weekly by the U.S. EIA.


Methodology
Haulwide doesn't yet have enough shipments of its own to publish averages, so every figure in this report comes from studies published by other companies, named below with their dates and methods. The studies disagree, so prices are shown as the span across them. Transit times follow the federal limit of 11 hours of driving a day.
Where these figures come from
Published industry studies, not Haulwide shipments. Checked Sep 16, 2026.
- SGT Auto Transport(opens in a new tab)
Published Sep 9, 2026. 30 months of the company's own shipping data (January 2024 to June 2026) across all 50 states and 1,581 state-to-state lanes, limited to completed single-vehicle open transport deliveries and mix-adjusted for distance.
- Move.org(opens in a new tab)
Published Mar 4, 2026. Nearly 800 broker quotes analyzed, priced for a running 2025 Toyota Camry with a one-week lead time using October 2025 quotes.
- Kelley Blue Book(opens in a new tab)
Published Jan 12, 2026. Quotes requested from eight transport companies for a 2025 Honda Accord on three routes from Orlando, on standard open carriers.
- Direct Connect Auto Transport(opens in a new tab)
No publication date given. The company's own carrier data for an operable sedan on open transport; the page states no publication date.
- RoadRunner Auto Transport(opens in a new tab)
Published Sep 1, 2026. The company's completed shipment history, which it describes as over 1 million vehicles delivered across 30+ years, updated September 2026. Its nationwide average is $1,215 at a median distance of 987 miles and a median $1.23 per mile.
The sources disagree, so figures are shown as the span across them rather than a single price. Pricing methodology
Frequently asked questions
Do most people book through brokers?
Brokers are a common way to book because they can search many carriers for a route. Both brokers and carriers must be licensed with FMCSA.
Broker vs. carrierWho regulates auto transport companies?
Interstate brokers and carriers are registered with the Federal Motor Carrier Safety Administration, which sets licensing, insurance and safety rules.
Can I cite this research?
Yes. Please credit Haulwide and link to the report page so readers can see the date and methodology.